The CQO data dilemma: 8 steps to overcome disparate systems and data sets
by Ashok Muttin, CEO, SupplyCopia
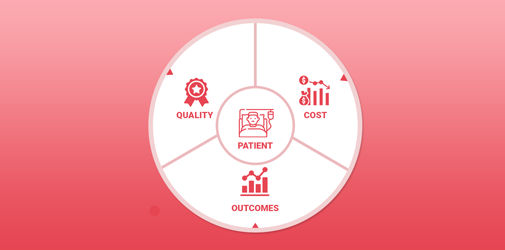
In order to impact cost, quality and outcomes (CQO), you need to know how much your health system or hospital spends on each procedure, how much you billed the payer, what the payer reimbursed you and whether the patient had a successful outcome, or experienced complications that added costs (e.g., infection, readmission).
All of this information belongs to different functions and resides in different systems:
Supply chain/ERP/product cost data
Clinical/point of use (POU) system/supply consumption data
Finance/cost accounting system/billing and reimbursement data, and
Quality/quality system/patient outcomes data
When an organization attempts to aggregate, normalize and present insights from these disparate data sets manually, the results are often outdated and usually outdated.
And nothing shuts down a CQO initiative faster than presenting data to clinicians that does not appear credible.
Here are eight proven steps to overcome disparate systems and data for CQO initiatives. These steps are based on SupplyCopia’s work with McLeod Health on the health system’s successful CQO initiative for total joint procedures:
Step 1. Clean, classify and code the data from each of the relevant systems (ERP, POU, cost accounting, quality) so that it is analyzable.
Step 2: Consolidate the data into a single system for integration and analysis.
Step 3: Generate a bill of materials (BOM) that creates the standard surgical “pack” of supplies to be used by the surgeon for each case.
Step 4: Integrate supply purchasing costs with the BOM to establish cost structures for each physician by procedure.
Step 5: Integrate reimbursement data with cost and utilization data to determine the cost for each procedure, what was billed to the payer and what the payer reimbursed.
Step 6: Integrate demographics data with cost and reimbursement data to correlate procedure costs and reimbursements to patient outcomes.
Step 7: Analyze the data through the use of artificial intelligence (AI) and machine learning (ML) to generate actionable insights on cost, quality and outcomes.
Step 8: Present the analytics through a single, user-friendly dashboard designed to meet the needs of each stakeholder group (e.g., clinicians, supply chain, finance, quality).
In McLeod’s case, stakeholders wanted to view CQO information by surgeon and by procedure as a consolidated report in the dashboard. They created a scoring methodology and assigned each surgeon a CQO score from 1 to 10, with 10 being the optimal cost, quality and outcomes measure.
The McLeod team felt that in order for this scoring to be impactful, it must be transparent. In response, SupplyCopia designed the dashboard so that the surgeons could access each other’s scoring information and the contributing factors. That way, they could compare performance to one another and uncover factors that raised or lowered scores.
“Once we had the data we presented it as it was; we didn’t play poker,” said Dr. Patrick Denton, orthopedic surgeon, director of sports medicine, and orthopedic service line leader for McLeod Health. “We showed everybody the cards, ‘here’s where we are.’”
“I think it was very enlightening for some of us to see that, wow, we’re barely making money on some of these joint procedures, if any, and there’s some where we lose money,” Dr. Denton added. Then displaying each physician’s cost, ‘let’s look at how come one doctor’s total knee procedures cost $2,000 more than another’s.’ And then the ability to micro dissect that data to examine the products we are utilizing and their impacts.”
Want to learn more about McLeod Health’s CQO initiative? Check out these videos from Dr. Patrick Denton and BJ McCluskey, as they each discuss how data was identified and assembled to support this pilot.
Ready to work on improving your organization’s data? Or maybe just take a step and improve your item master data? The team at SupplyCopia is ready to help. Reach out anytime — we’ll get right back to learn more about your current state of cost, quality and outcomes.
More from SupplyCopia
Blog | SupplyCopia and Ron Denton & Associates Team Up to Advance Healthcare Supply Chain Solutions…
 ALL Solutions